Introduction
People keep asking whether to use the Java Kafka client or a Rust one for a high-throughput service. I could not find a benchmark that runs both against the same broker, on the same hardware, with the same bytes. So I built one.
The first numbers made Rust look up to 16x slower. This post is about what happened next. Every gap had a specific, fixable cause, and none of them was “Rust is slow” or “Java is slow”.
The two clients:
- Java:
org.apache.kafka:kafka-clients4.3.1 on Temurin JDK 25. - Rust:
rdkafka0.39.0, the most used Rust client. It wraps the C library librdkafka 2.12.1, which the Python, Go, .NET and Node clients also wrap, so most of this applies to them too.
Building a fair test bench
It is easy to build a client benchmark that quietly favours one side. Here is what “same conditions” meant for me.
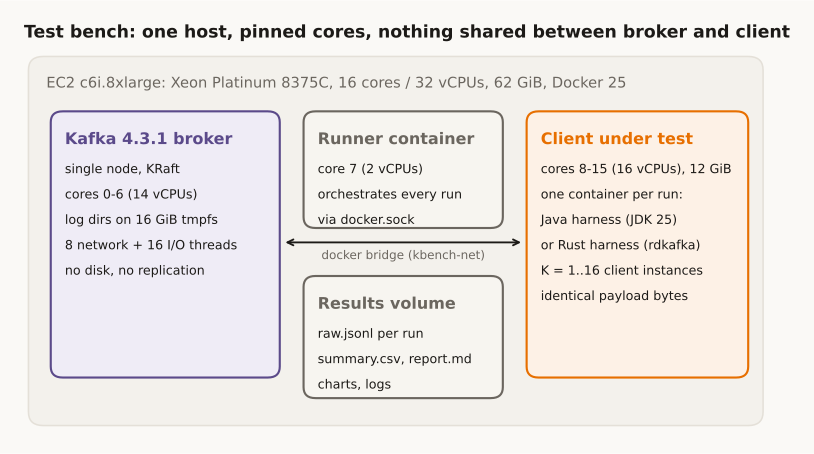
One host, pinned cores. Everything runs in Docker on one EC2 c6i.8xlarge (16 physical cores, 32 vCPUs). The Kafka 4.3.1 broker gets cores 0 to 6, the client gets cores 8 to 15, and core 7 is left for the orchestrator. Hyperthread siblings stay with their core, so broker and client never share a physical core.
A broker that is not the bottleneck. The broker writes to a 16 GiB tmpfs, so disk is out of the picture, and runs 8 network and 16 I/O threads. It is a single node with replication factor 1. The numbers are about client overhead, not a production cluster.
Identical bytes. Both harnesses build payloads with the same SplitMix64 generator and seed, and the orchestrator checks a SHA-256 of both payload pools before every run. Compression tests use word-list text so the codecs have something to work with.
Explicit partitioning. The two clients spread keyless records differently, so both harnesses pick the partition themselves (round robin).
The same configuration, knob by knob. For the first run I set every producer and consumer setting explicitly in both clients: acks, linger.ms, batch.size, max.in.flight, buffer sizes, retries, timeouts, fetch sizes, CRC checks. Where librdkafka has a knob Java lacks, I set it out of the way (for example batch.num.messages=1000000, so the byte limit governs like in Java).
Measurement. Each run warms up for at least 200k messages so the JIT has compiled the hot paths, then measures. Producer latency is send-to-ack per record; end-to-end latency comes from a timestamp in the payload. Every scenario ran 3 times in shuffled order, alternating which client went first. I report the median, and only call a difference real when the min/max ranges do not overlap.
Detached. The orchestrator runs in a container on the benchmark host, so a 6-hour run does not depend on my laptop staying awake. The harness, scripts and full analysis are in java-vs-rust-kafka-client-benchmark.
The first run: Java wins almost everywhere
The first full run was 372 client runs over 64 scenarios, 5 hours and 14 minutes. Here is Rust’s throughput as a fraction of Java’s:
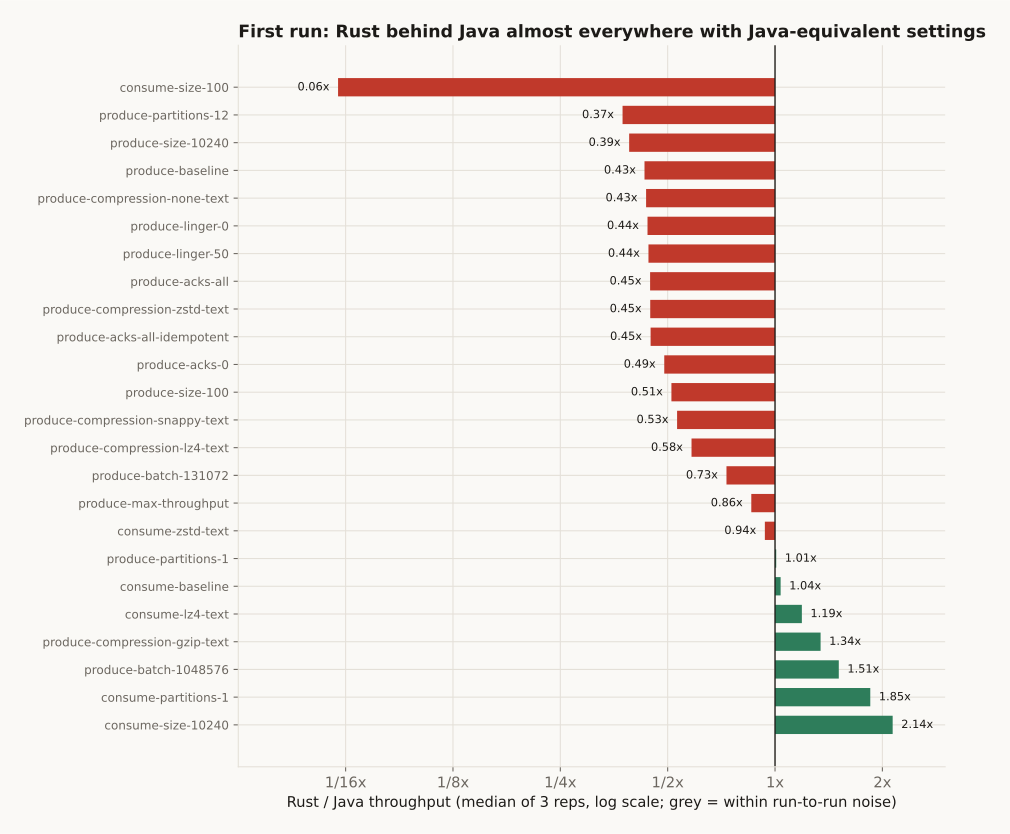
The Rust producer sat at 0.4x to 0.6x of Java almost everywhere. The consumer was closer, and Rust even won at 10 KB messages (2.1x). But at 100 B messages Rust reached 0.06x: 343k msg/s against Java’s 5.8M.
A 16x gap between two mature clients is not a language difference. Something specific was wrong, so I paused the full runs and started digging.
Gap 1: the producer that would not go faster
The clue
The Rust producer stayed at about 240k msg/s (1 KB messages, about 250 MB/s) no matter what I changed: 1, 6 or 12 partitions, linger.ms 0, 5 or 50, acks 0, 1 or all. Java went from 570k to 653k msg/s when I doubled the partitions to 12. But with 1 partition, Java dropped to 245k, exactly Rust’s number. Both clients hit the same wall, and Java got past it when it had several partitions.
What did not help
My first guess was the in-flight window. I had set max.in.flight.requests.per.connection=5 in both clients, but that is Java’s default; librdkafka’s is 1,000,000. So I added a native profile to the Rust harness that leaves every knob I am not sweeping at librdkafka’s default. Then I tried Nagle’s algorithm (Java always sets TCP_NODELAY, librdkafka does not) and librdkafka’s backpressure threshold:
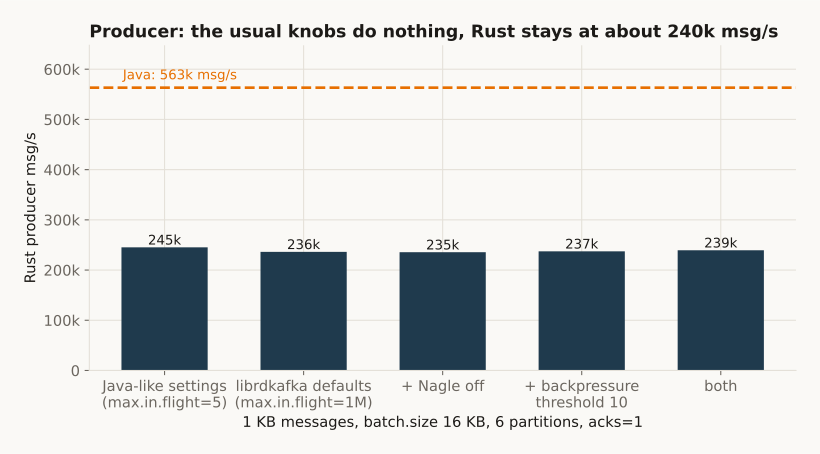
Nothing moved. The client was not busy either: per-thread CPU from /proc showed no thread near a full core.
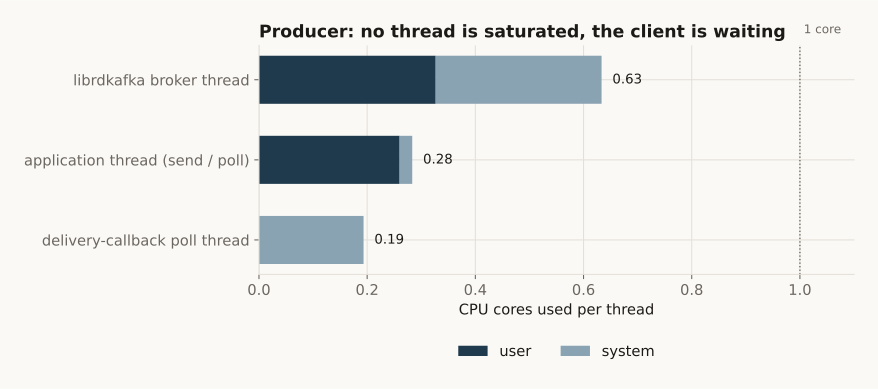
A client that is not CPU-bound and not limited by its window is waiting on the other side.
Looking at the wire
librdkafka logs every protocol request with debug=protocol. During the baseline run, every ProduceRequest looked like this:
Sent ProduceRequest (v10, 15621 bytes @ 0, CorrId 4)
Received ProduceResponse (v10, 62 bytes, CorrId 4, rtt 0.39ms)
A 15.6 KB request is one 16 KB batch, and a 62-byte response covers one partition. librdkafka sends one partition’s batch per ProduceRequest, and I found no option to change that.
The other half is on the broker: Kafka handles one connection’s requests strictly one at a time, and with one broker the client has one connection. So the Rust producer was bound by the broker’s cost per request: 250 MB/s in 15.6 KB requests is about 15,400 requests per second, about 65 microseconds each, whatever the partitions or window.
Java packs the batches of all partitions for a broker into one request. With 6 partitions, each request carries 6 batches and the fixed cost is spread over 6 times the data. With 1 partition there is nothing to pack, and Java hits the same ceiling.
The fix: bytes per request
If the cost is per request, send more bytes per request. That knob is batch.size:
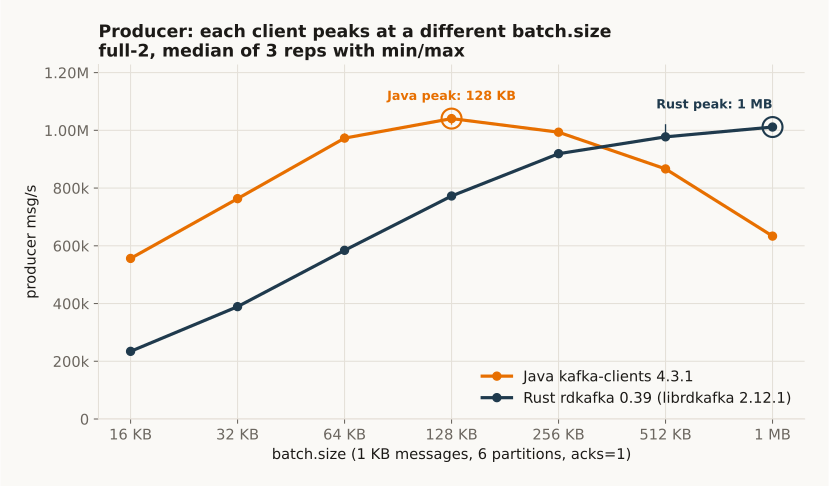
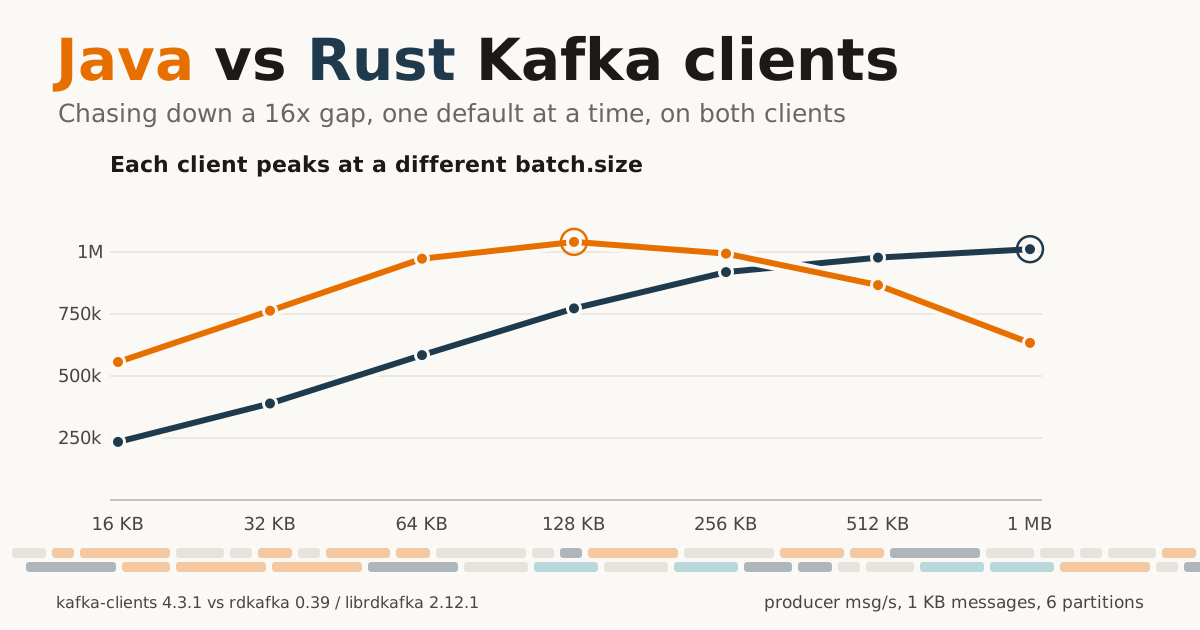
Rust climbs steadily, passes Java at 512 KB and peaks at 1 MB. Java peaks at 128 KB and then declines (Gap 3 explains why). The peaks are about the same height, around 1 GB/s, roughly what one connection to this broker can carry.
The embarrassing part: librdkafka’s default batch.size is 1 MB. My “fair” first run forced Java’s 16 KB default on librdkafka, which is close to its worst case. Matching knob values is not the same as matching behaviour.
Gap 2: the consumer that took naps
The clue
The 100 B consumer gap was stranger. The Rust consumer used only 0.45 cores at 390k msg/s, and its per-second counts were lumpy: 457k, 571k, 400k, then 53k. It kept stopping.
Looking at the fetcher
debug=fetch had the answer in one line:
Fetch backoff for 1000ms: Local: Queue fullWhen a partition’s local queue reaches queued.min.messages (100,000 by default), librdkafka stops fetching it for fetch.queue.backoff.ms, which defaults to 1000 ms. At 100 B, 100,000 messages is about 10 MB, which the application drains in a few milliseconds. Then the fetcher sleeps for the rest of the second. Java has no timed backoff: it fetches again as soon as the buffered records are consumed.
Fixing it, one step at a time
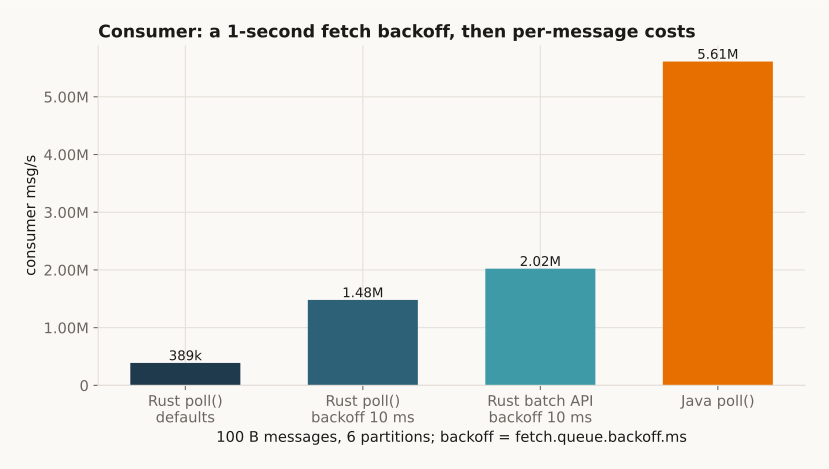
fetch.queue.backoff.ms=10removes the naps: 389k to 1.48M msg/s, 3.8x. Setting it to 0 is worse than 10 ms; my guess is the fetcher then keeps re-checking a full queue.- Now the polling thread was saturated. rust-rdkafka’s
poll()returns one message per call, while Java’s returns up to 500. rust-rdkafka 0.39 does not wrap librdkafka’s batch API, so I calledrd_kafka_consume_batch_queuethrough the C bindings, 500 messages per call: 2.02M msg/s, 5.2x where I started. - The next limit is inside librdkafka: its broker thread builds an internal entry for every fetched message and saturates a core.
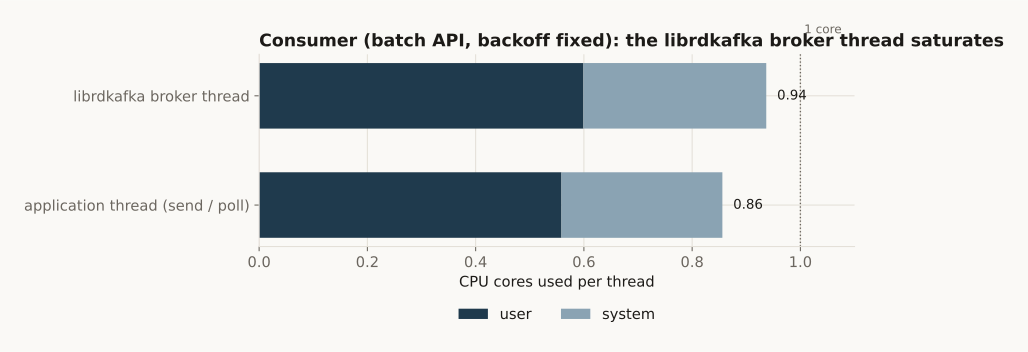
That per-message cost is how librdkafka is built, not a knob. For tiny messages one Java consumer is still more than twice as fast as one librdkafka consumer. For large messages it flips: at 10 KB librdkafka fetches on a separate thread and reaches 3.4 GB/s, while Java stays at about 1.4 GB/s even with CRC checks off and 8 MB fetches. That points at per-byte work on Java’s single polling thread.
The rerun
With both causes understood, I changed the matrix and ran everything again: 70 scenarios, 3 reps each, 609 client runs in 6 hours. What changed:
- The Rust producer uses the
nativeprofile: knobs a scenario does not sweep stay at librdkafka’s defaults, not Java’s. - A third client, rust-tuned, is the Rust consumer with both Gap 2 fixes (
fetch.queue.backoff.ms=10and the batch API at 500 messages per call, like Java’smax.poll.records). Its producer is the same as plain Rust. - New producer scenarios:
produce-defaultsruns each client at its own defaults,produce-bestat thebatch.sizewhere it peaked, and thebatch.sizesweep has 7 points from 16 KB to 1 MB.
Producer: the answer depends on the question
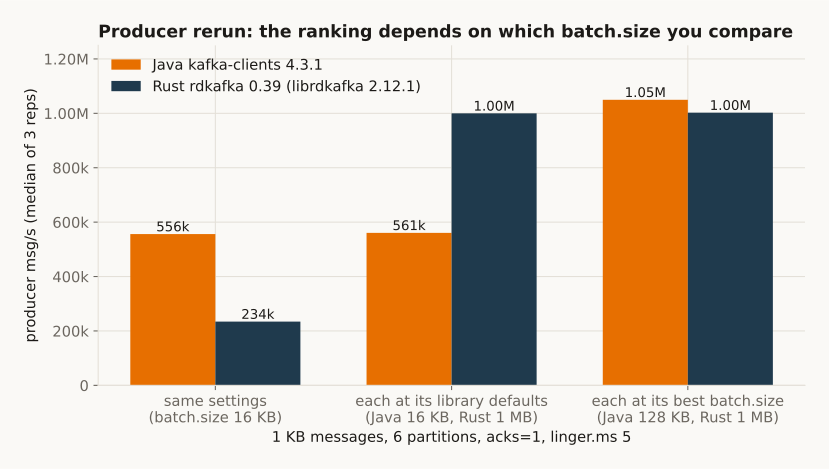
Same producers, three answers:
- Same 16 KB batches: Rust 0.42x (234k against 556k). The first run said 0.43x, so the gap is real, not noise.
- Each at its own defaults: Java stays at 561k with 16 KB; Rust jumps to 1.00M with 1 MB. Rust is 1.78x faster, which is what you would see running both out of the box.
- Each at its best
batch.size: Java 1.05M at 128 KB, Rust 1.00M at 1 MB, with almost the same CPU (1.91 and 1.96 CPU seconds per million messages). Close to parity. Java’s best was still held back by a socket buffer default; Gap 3 shows it reaches 1.12M with that fixed.
The sweep reproduced with 3 reps: Java rises to 1.04M at 128 KB and falls to 634k at 1 MB; Rust passes Java at 512 KB (977k against 866k) and ends at 1.01M. Neither client wins the producer comparison in general. Each needs its own batch.size, and the defaults happen to favour librdkafka.
Consumer: the fixes hold
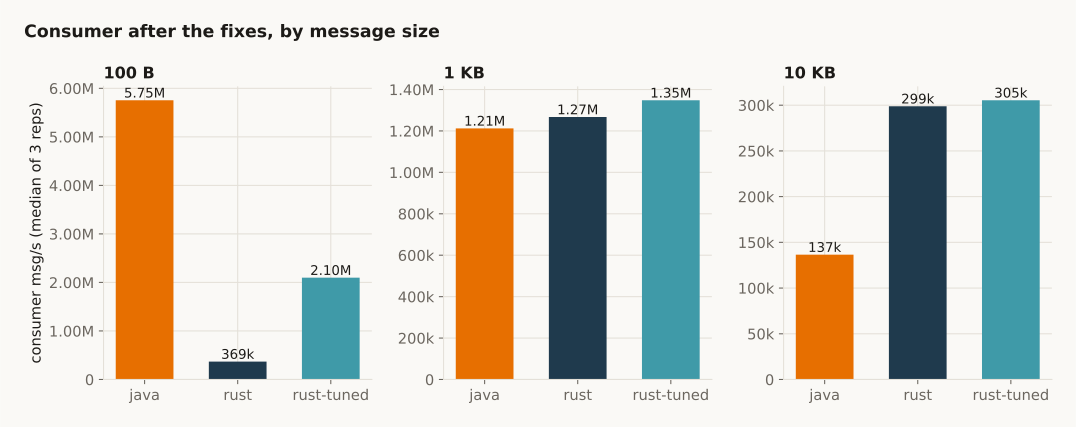
| Scenario | Java | Rust | rust-tuned | rust-tuned / Java |
|---|---|---|---|---|
| 100 B | 5.75M | 369k | 2.10M | 0.36x |
| 1 KB | 1.21M | 1.27M | 1.35M | 1.11x |
| 10 KB | 137k | 299k | 305k | 2.24x |
| 1 KB lz4 | 931k | 1.10M | 1.29M | 1.38x |
| 1 KB zstd | 595k | 561k | 577k | 0.97x (noise) |
| 1 KB, 1 partition | 1.11M | 2.01M | 2.15M | 1.94x |
The tuned consumer is 5.7x plain Rust at 100 B and never slower elsewhere. At 100 B it still reaches only about a third of Java, because the librdkafka broker thread saturates. From 1 KB up both Rust consumers lead. zstd is a tie, since decompression dominates for both.
First run against rerun:
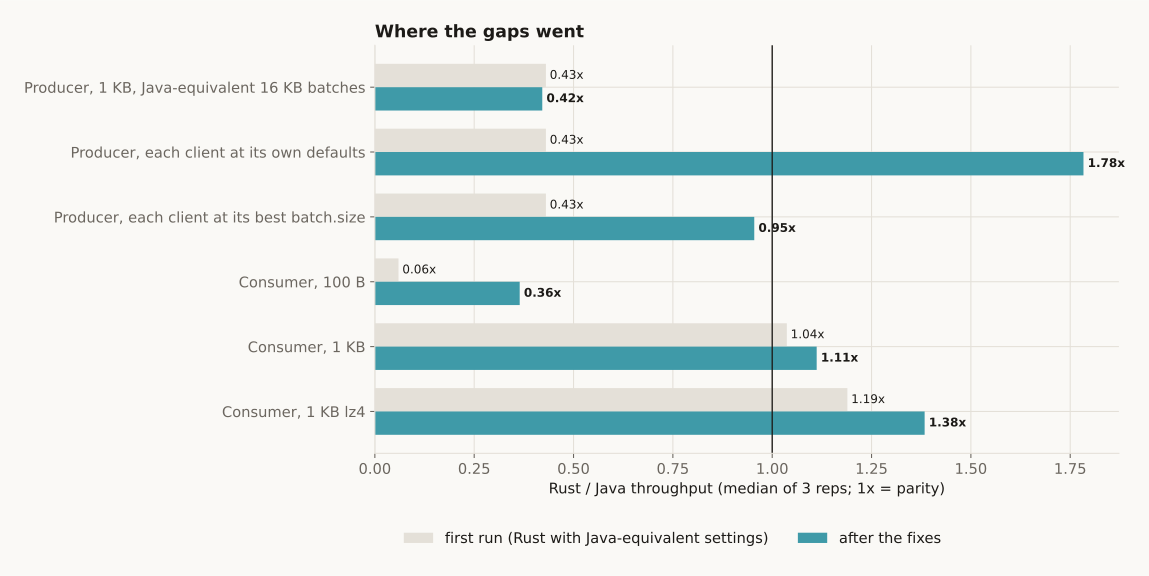
The 16x consumer gap at 100 B is now 2.7x, the producer gap is gone with a sensible batch.size, and the 1 KB consumer cases moved further toward Rust.
Scaling to the whole host
One instance measures per-connection efficiency. To find each client’s ceiling on this host, the scaling scenarios run K independent instances in one process, each with its own connection, from K=1 to K=16:
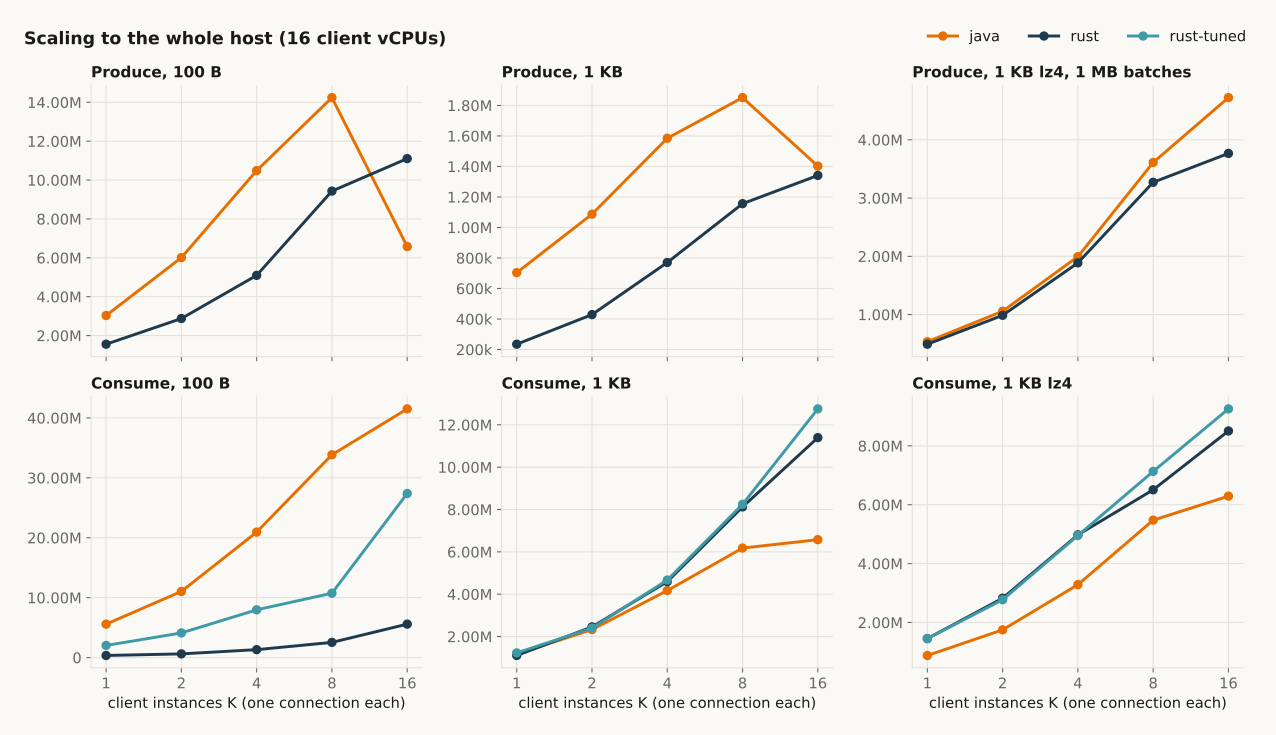
| Profile | Java peak | Rust peak | rust-tuned peak |
|---|---|---|---|
| Produce 100 B | 14.2M (K=8) | 11.1M (K=16) | - |
| Produce 1 KB, 16 KB batches | 1.85M (K=8) | 1.34M (K=16) | - |
| Produce 1 KB lz4, 1 MB batches | 4.72M (K=16) | 3.77M (K=16) | - |
| Consume 100 B | 41.5M (K=16) | 5.6M (K=16) | 27.4M (K=16) |
| Consume 1 KB | 6.6M (K=16) | 11.4M (K=16) | 12.8M (K=16) |
| Consume 1 KB lz4 | 6.3M (K=16) | 8.5M (K=16) | 9.3M (K=16) |
Two things stand out. The Java 100 B producer peaks at 8 instances and then drops to 6.6M at K=16, with a send-to-ack p99 of 514 ms; GC pauses take 37% of the window there, against 1% at K=8. Rust keeps scaling to 11.1M, though that point is noisy (7.5M, 11.1M, 11.2M across reps). And 16 tuned Rust consumers read about 13 GB/s of 1 KB messages, almost twice Java.
The fastest consumer runs measure only about a second, because the 16 GiB tmpfs caps how much a topic can hold. Treat those peaks as upper bounds.
What it costs
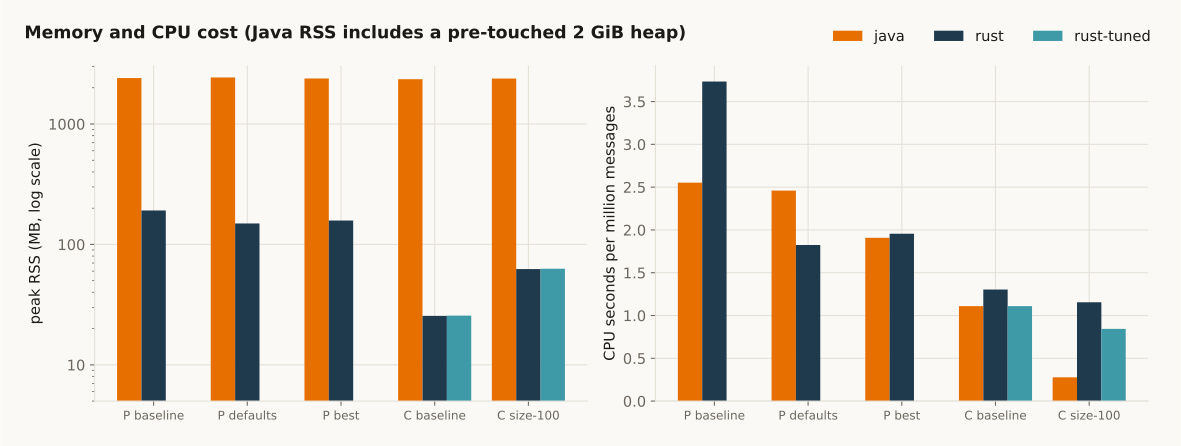
- Memory: Java’s RSS is about 2.4 GB everywhere, but that is the 2 GiB heap I pre-touch, not live data. One Rust instance uses 9 MB to 1.2 GB, depending on how much it buffers.
- CPU: Rust uses a median 1.22x Java’s CPU per million messages, from 0.45x (10 KB consumer) to 4.15x (100 B consumer). At each client’s best producer settings they are within 3%.
- GC: in single-instance runs, a median 0.6% of the window. GC only matters at K=16.
- Startup: 260 ms to a ready Java client, 0.8 ms for Rust. Outside every throughput window, but it matters for short-lived jobs.
Gap 3: the Java side
The rerun left four places where Java trails Rust or its own best: the producer slows down past 128 KB batches, one consumer stops at about 1.4 GB/s, 16 producers in one JVM deliver less than 8, and gzip is slower. The Rust gaps had specific causes, so I gave the Java ones the same treatment: JMX metrics every second, per-thread CPU from /proc, JDK Flight Recorder profiles, and the kafka-clients 4.3.1 source. These are single diagnosis runs unless I list several values, so treat differences under about 3% as noise.
The producer that got slower with bigger batches
Java peaks at 1.04M msg/s with 128 KB batches and falls to 634k at 1 MB. The obvious suspects did not hold up:
| Suspect (1 MB batches) | Result | Verdict |
|---|---|---|
buffer.memory 1 GB instead of 256 MB |
623k msg/s | not memory; the pool runs dry because the sender drains slowly |
| Large buffers bypassing the pool | every buffer is exactly batch.size, so it is pooled |
not allocation |
| GC | 2 young collections, about 30 ms per run | not GC |
| Broker cost of large requests | 1.02 s broker CPU per GB at 1 MB, 1.08 s at 128 KB | broker is not working harder |
| In-flight window | 1 of 5 requests in flight | something keeps the window from filling |
Big requests. Gap 1 ended with what makes Java fast: one batch per partition in every request. With 6 partitions and 1 MB batches, each request is 6.29 MB, and a big request turns out to be expensive to write.
Copying the tail on every write. I read this in the source and measured the cost. Java’s batch buffers live on the heap. When a heap buffer is written to a socket, the JDK first copies all remaining bytes into a temporary direct buffer, calls writev, and throws away whatever the kernel did not take. The socket’s send buffer is fixed by send.buffer.bytes (128 KB by default), so each write takes only about 298 KB. A 6.29 MB request needs about 22 writes, and each one copies the whole unsent rest again:
| Case | Request | Writes | Bytes copied | Copy amplification | Time per write |
|---|---|---|---|---|---|
| 128 KB batches | 0.78 MB | 3 | 1.45 MB | 1.9x | 73 us |
| 1 MB batches | 6.29 MB | 22 | 69.6 MB | 11.1x | 296 us |
1 MB, send.buffer.bytes=-1 |
6.29 MB | 10 | 31.8 MB | 5.1x | 349 us |
| 1 MB, one batch per request | 1.05 MB | 4 | 2.41 MB | 2.3x | 91 us |
At 1 MB, copying 3.2 MB per write should take about 290 us; I measured 296 us. Thread CPU agrees: the network thread spends 1.02 user-space CPU seconds per GB at 1 MB against 0.44 at 128 KB, while kernel time per byte stays flat. The extra work is copying, not sending.
Why that caps throughput (my reading, not measured directly). The client starts the next request on a connection only after the current one is fully written, and the broker handles one request at a time. While the network thread re-copies the tail of a 6 MB request, the broker waits for bytes. That fits the in-flight count stuck at 1.
The fix: let the OS size the socket buffer.
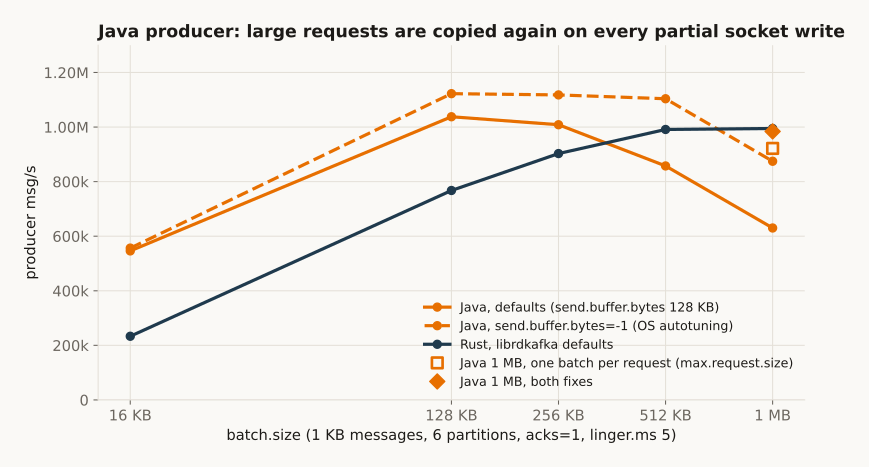
With send.buffer.bytes=-1 the kernel autotunes the buffer (up to 4 MB here), each write takes about 692 KB, and the curve flattens: 1 MB goes from 630k to 875k msg/s (888k, 875k, 862k) and the 128 KB peak rises to 1.12M. Keeping requests small also works: max.request.size=1100000, one batch per request like librdkafka, gives 922k, and both fixes together 984k.
That changes the “each at its best” result. librdkafka leaves socket buffers to the OS by default, so the rerun compared an autotuned librdkafka socket against a fixed 128 KB Java one. With both autotuned, Java’s best is 1.12M against Rust’s 1.00M. The Java number comes from diagnosis runs, not the 3-rep rerun, so I read it as “at least parity” rather than a precise 1.1x.
The consumer that runs on one core
One Java consumer reads 1.23M msg/s at 1 KB (1.25 GB/s), 133k at 10 KB (1.36 GB/s) and 1.08M from a single partition. Rust reads 1.44M, 333k (3.4 GB/s) and 2.09M from the same topics. max.poll.records=5000, CRC checks off and 8 MB fetches changed nothing, and GC was about 20 ms per run.
One thread does all the per-byte work. In the classic consumer, the thread that calls poll() also reads the socket. It sits at 0.95 to 0.98 cores in every configuration I tried. The profile shows where that core goes:
| Share of the polling thread | 1 KB | 10 KB |
|---|---|---|
| Socket reads, total | 51% | 58% |
| of which the kernel read | 39% | 43% |
| of which the JDK copying into the heap | 10% | 13% |
| Record parsing and copying each value | 30% | 29% |
The receive buffer is fixed at receive.buffer.bytes (64 KB by default), so a 6 MB fetch response arrives in reads of about 56 KB, 22,500 per second at 1.25 GB/s. librdkafka reads on its own thread with an autotuned buffer and hands the application pointers into its buffers, so the application thread does neither.
The new consumer protocol does not help. With group.protocol=consumer, network I/O moves to a background thread (0.66 cores) and the application thread uses 0.37: still about one core, still 1,195k msg/s. From the source, my explanation is that both implementations fetch only partitions with no buffered data and keep one fetch in flight per broker. The work is split over two threads but still runs in sequence.
The fix: again, let the OS size the socket buffer.
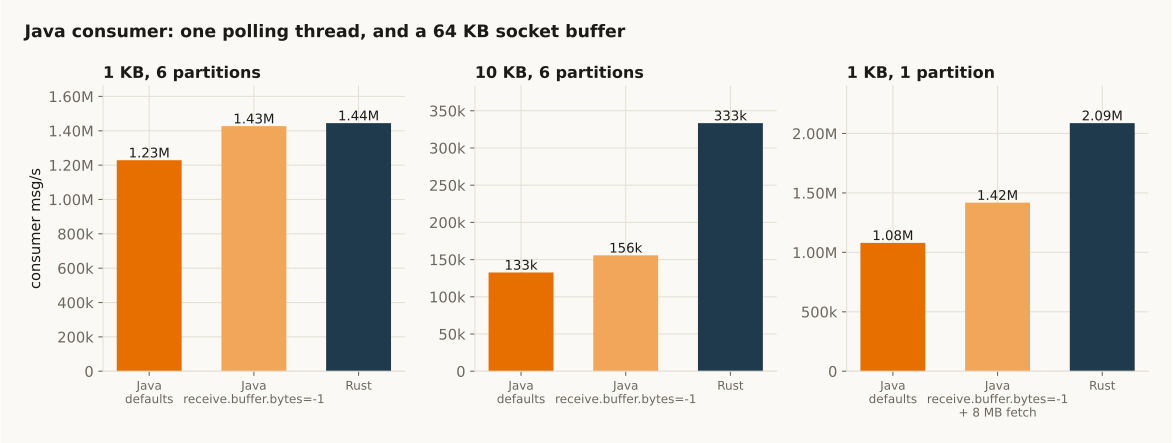
receive.buffer.bytes=-1 halves the reads and adds 16 to 17%: 1 KB goes to 1.43M msg/s (1,413k, 1,427k, 1,432k), level with Rust, and 10 KB to 1,595 MB/s. On a single partition, where every 1 MB fetch is a round trip, adding an 8 MB max.partition.fetch.bytes takes it to 1.42M. What is left is architectural: one KafkaConsumer does its per-byte work on one core, about 1.4 to 1.6 GB/s. At 10 KB Rust is still 2.1x ahead, and the Java answer is more consumers, not more tuning.
The producer that collapsed at K=16
The rerun already pointed at GC: 37% of the window at K=16. The question was why 16 instances make so much garbage when 8 make almost none.
GC collapse. I reproduced it with GC logging and a class histogram:
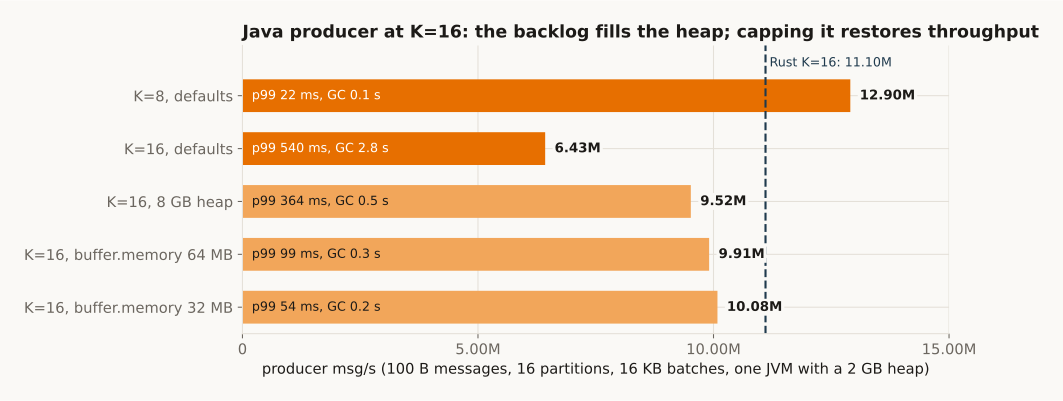
At K=16 the heap stays almost full after every young collection (1913 MB to 1846 MB of 2048 MB), evacuations fail, and a 105 to 117 ms full GC runs about once a second. GC threads use 4.79 cores, more than the 16 application threads (4.50) or the 16 network threads (3.92). At K=8 a young collection takes the heap from 1440 MB to 214 MB in 1.3 ms.
What is live. The histogram shows 2.27M records waiting in the accumulators. Each carries five or six small objects: the append callback, the FutureRecordMetadata from send(), a RecordHeaders with its ArrayList, a batch thunk, and my harness’s latency callback. That is about 190 B of objects per 100 B record, 436 MB in total, next to 273 MB of buffers. They live for 300 ms or more, survive young collections and fill the old generation.
The trigger (inferred). Each Java producer has two busy threads, the caller and the network thread, so K=16 means 32 busy threads on 16 vCPUs. Once the network threads fall behind, the queues fill to buffer.memory, GC eats about a third of the CPU, and they fall further behind. At K=8 the queues stay nearly empty.
The fix: bound the backlog. buffer.memory limits how many records can wait:
| K=16 configuration | msg/s | send-to-ack p50 / p99 | GC time |
|---|---|---|---|
harness defaults (256 MB buffer.memory in total, 2 GB heap) |
6.4M, 6.8M | 337 / 540 ms | 2.8 s |
| 8 GB heap | 9.5M | 183 / 364 ms | 0.5 s |
buffer.memory 64 MB in total |
9.9M | 43 / 99 ms | 0.3 s |
buffer.memory 32 MB in total |
10.1M | 16 / 54 ms | 0.2 s |
With 2 MB per instance, 16 Java producers reach 10.1M msg/s at 54 ms p99, 91% of Rust’s 11.1M. A bigger heap helps less and leaves p50 at 183 ms, because the queues stay full. librdkafka never hits this: its per-message state is not on a garbage-collected heap.
gzip: not the same batch
At the same 16 KB batch.size, Java produced 33.9k msg/s of gzip-compressed 1 KB text against Rust’s 46.4k. Java’s sending thread sits at a full core, 96% of it in zlib’s deflate, and librdkafka’s broker thread is also at a full core. Both use zlib at its default level 6, so the codec settings are not the difference.
The same setting means different things. Java closes a compressed batch when its estimated compressed size reaches batch.size; librdkafka limits the uncompressed bytes. So a Java batch holds about 43 KB of input and a librdkafka batch 16 KB. zlib is slower per byte on longer input, and compresses it better:
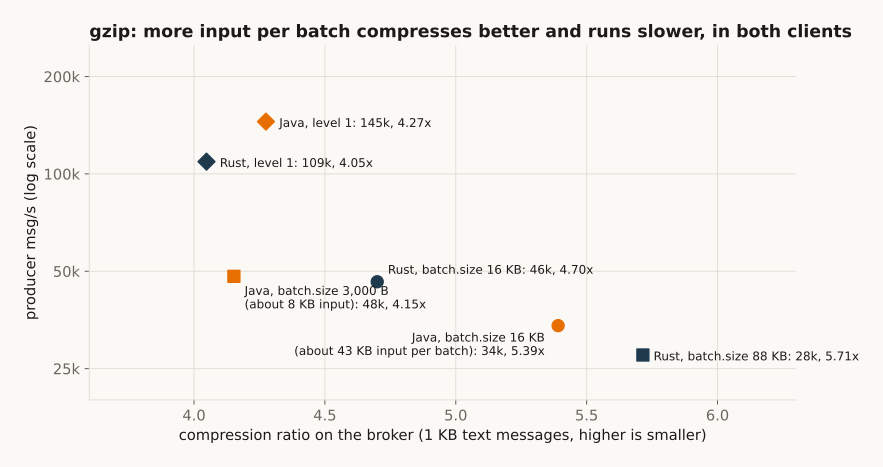
Matching the input per batch flips the result both ways: Rust with 88 KB batches drops to 27.5k msg/s at a ratio of 5.71, and Java with 3,000 B batches (about 8 KB of input) rises to 48.2k at 4.15. Neither zlib is faster. At level 1, Java reaches 145k and Rust 109k. The rerun’s gzip result is a trade of speed for ratio: Java wrote 13% fewer bytes to the broker.
What the Java side has in common with the Rust side
Two of the four Java gaps were defaults, like the Rust ones: a fixed 128 KB send buffer and a fixed 64 KB receive buffer. The third was a backlog one heap cannot carry once 16 producers oversubscribe the CPUs. The fourth was a knob with the same name and a different meaning. Once each was set on purpose, only architectural gaps were left: one core per KafkaConsumer, and librdkafka’s per-message cost at 100 B.
Latency trade-offs
Throughput runs push as fast as the client accepts, so their send-to-ack latency is mostly time queued in the client buffer. Latency needs its own scenarios: a producer sends 1 KB messages at a fixed rate (1k, 10k or 50k msg/s) with linger.ms 0 or 5, and a consumer of the same client measures end-to-end latency from a timestamp in the payload.
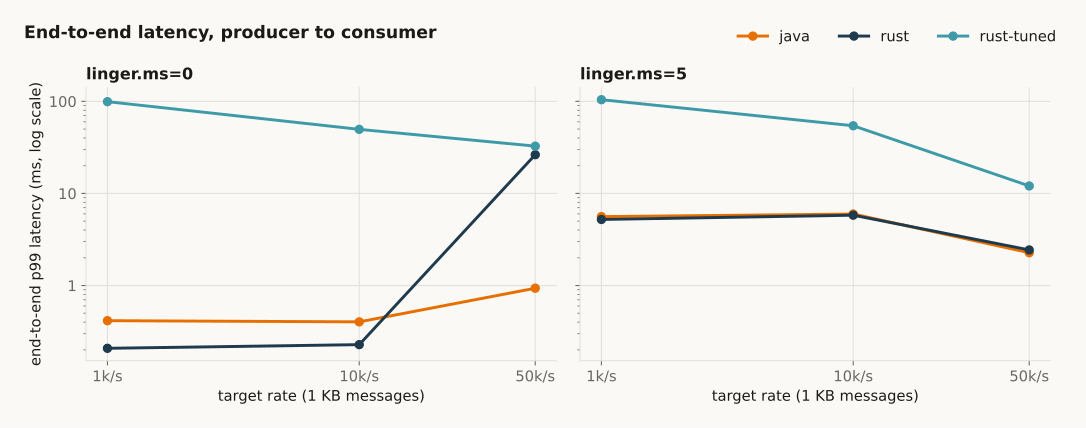
Most of this chart is unremarkable. At linger.ms=5 Java and Rust are within 10% at every rate. At linger.ms=0 and low rates Rust is lower (0.21 ms p99 against 0.41 ms at 1k/s). Two lines stand out, and both came from changes I made for the rerun.
The in-flight window
At linger.ms=0 and 50k msg/s, Rust’s end-to-end p99 is 26.3 ms, against Java’s 0.94 ms. In the first run it was 1.94 ms. The one producer knob in the native profile that plausibly affects latency is max.in.flight: 5 in the first run, 1,000,000 in the rerun. I tested it alone:
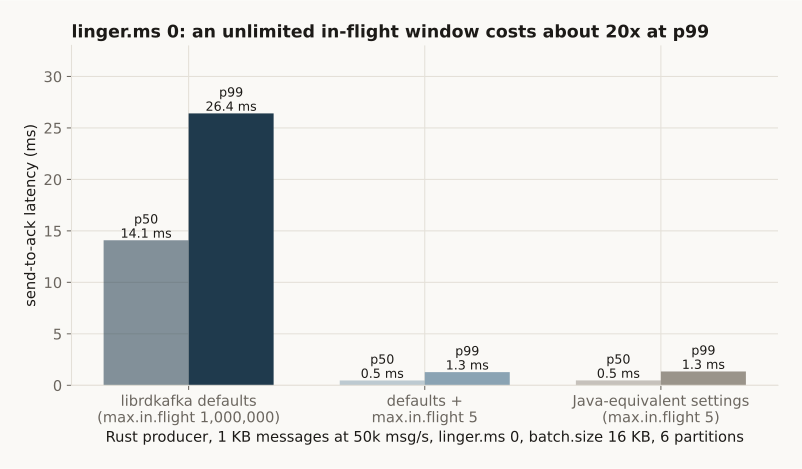
max.in.flight=5 alone takes the producer’s send-to-ack p50/p99 from 14.1/26.4 ms to 0.5/1.3 ms, the same as the first run’s settings. All three runs held 50k msg/s, so throughput is not the price.
I could not confirm the mechanism: debug=protocol slowed the client too much. My explanation: with linger.ms=0 and an unlimited window, librdkafka sends a request as soon as a message or two is ready, so at 50k msg/s it sends a stream of tiny requests. Gap 1 showed the broker handles them one at a time with a fixed cost each, so they queue. With a window of 5, messages wait for a free slot and coalesce into larger batches. At 1k and 10k msg/s the queue never builds.
So librdkafka’s defaults are good for throughput and bad for latency at linger.ms=0. Use a large batch.size for throughput and max.in.flight around 5 for latency; they do not conflict.
The tuned consumer that waits
The rust-tuned line is far above the rest: a p99 of 99 ms at 1k/s and 50 ms at 10k/s with linger.ms=0 (104 and 54 ms at linger.ms=5), against 0.4 to 6 ms for Java. Its producer is plain Rust, so this is the consumer.
The cause is my batch wrapper, and the arithmetic shows it. It calls rd_kafka_consume_batch_queue(queue, 100 ms, buf, 500), which returns at 500 messages or after 100 ms. At 1k msg/s, 500 messages take 500 ms, so every call waits the full 100 ms and a message waits a uniformly random part of it: p50 50 ms, p99 99 ms, exactly what I measured. At 10k msg/s, 500 messages take 50 ms: p50 25 ms, p99 50 ms, again exact. Java’s poll() returns as soon as anything is there.
That is a harness bug, not a librdkafka property. The fix is small: take whatever is queued without waiting, and block only when the queue is empty. Throughput at 100 B did not move (2.12M to 2.14M msg/s over three runs, 2.10M before).
The latency rerun
With the wrapper fixed, I reran every latency scenario, 3 reps each, and added a fourth client: rust-lowlat, the plain Rust client with max.in.flight=5. These numbers replace the rust-tuned latencies in the chart above.
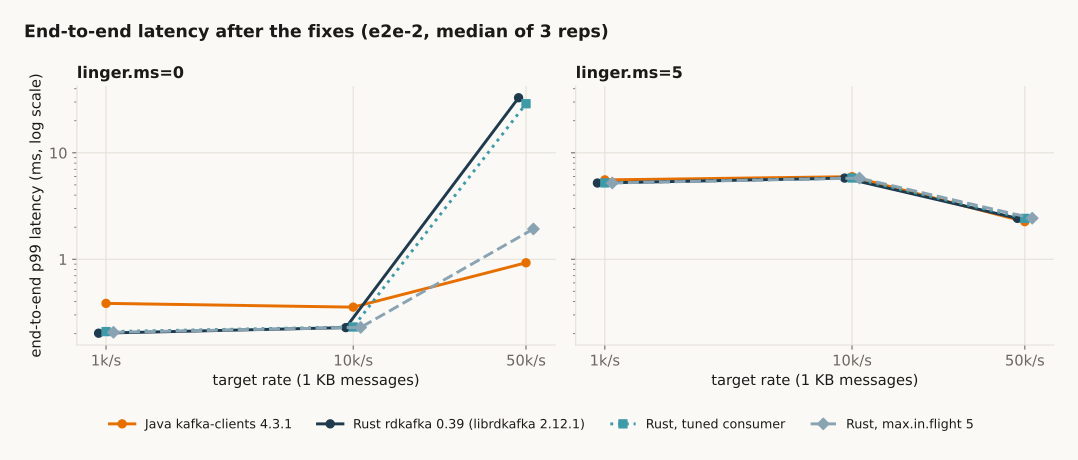
- The tuned consumer now behaves. At
linger.ms=0its p99 is 0.21 ms at 1k/s and 0.23 ms at 10k/s, down from 99 and 50 ms, and the same as plain Rust. - The in-flight window is the only big gap left. At
linger.ms=0and 50k/s, Rust at librdkafka defaults is at 17.6 / 32.9 ms p50 / p99. Withmax.in.flight=5it drops to 0.66 / 1.93 ms. Java is at 0.64 / 0.93 ms. Rust’s p99 is still twice Java’s there, and that difference is on the producer side; I did not chase it. - Everywhere else it is close. At
linger.ms=0and low rates, all Rust variants are a little faster than Java (0.20 ms p99 against 0.39 ms at 1k/s). Atlinger.ms=5all clients are within 8% at p99.
One number looked odd: at linger.ms=5 and 1k/s, Java’s p50 is 3.3 ms and Rust’s is 5.1 ms. The two clients apply linger differently. In the Java source, linger only decides when a broker connection is ready to send. Once one partition’s batch has waited 5 ms, Java drains the waiting batches of every partition on that broker, including ones that just started. So a message waits about half the linger on average; its producer p50 is 2.8 ms. librdkafka counts linger for each partition. At 1k/s over 6 partitions, each partition sees one message every 6 ms, so nearly every message waits the full 5 ms (producer p50 5.1 ms). At 10k/s batches fill up faster than that on both sides, and the p50s meet at about 3 ms.
What is left, and why
After all of this, a few gaps remain. None of them is a setting I missed.
- Rust consumer at 100 B: about a third of Java per instance. librdkafka builds one queue entry per fetched message on its broker thread, and that thread saturates at about 2.1M msg/s. The batch API only saves work on the application side. Java parses records straight out of the fetch buffer. This is how librdkafka is built; the only lever I found is more instances.
- Java consumer at 10 KB and on one partition: Rust is 2.1x and 1.5x ahead. One
KafkaConsumerdoes its socket reads, parsing and copies on about one core, with either consumer protocol. Again, the answer is more consumers. - Java producer at large batches. OS-sized socket buffers cut the re-copying from 11x to 5x at 1 MB but do not remove it. Keep
batch.sizeat 256 KB or below, or capmax.request.size. - Java producer beyond the core count. Capping
buffer.memorystops the collapse, but 16 instances still do not beat 8 on this host. - Rust producer at small
batch.size. One partition per request means the broker’s per-request cost sets the ceiling. librdkafka’s own 1 MB default already avoids it. - Latency at
linger.ms=0and 50k/s. Withmax.in.flight=5Rust’s p99 is still about twice Java’s. I did not dig into that one. - One noisy point. Rust with 16 instances at 100 B gave 7.5M, 11.1M and 11.2M across reps. I did not investigate it.
Takeaways
- The first run mostly measured configuration. Java’s 16 KB
batch.sizeimposed on librdkafka, librdkafka’s 1-second fetch backoff, Java’s fixed socket buffers, an oversized backlog, and abatch.sizethat means different things under compression. None of these was about the language. - Mapping settings one to one is not enough. The same name can drive different behaviour in each client. Measure each client at its own defaults and at its own best, not only at matched settings.
- Tuned, the producers are close. Java reaches 1.12M msg/s with OS-sized socket buffers and Rust 1.00M, at a different
batch.sizeeach. - Rust reads faster from 1 KB up (2.1x at 10 KB per instance). Java reads 100 B messages about 2.7x faster and scales its producer better up to the core count.
- Rust costs less memory, fewer threads and no GC, and starts in under a millisecond. It uses a median 1.22x Java’s CPU per million messages.
- For latency, set
max.in.flightto about 5 on librdkafka. With it, Rust’s worst p99 across all latency scenarios is 5.8 ms against Java’s 6.0 ms. Without it, Rust reaches 32.9 ms atlinger.ms=0and 50k/s.